Real Estate Investar VS PriceFinder VS RP Data Comparison: Which Is Best?
Last Updated: September 27, 2016
UPDATE: PriceFinder have completely overhauled their system recently, and I’ve gotta say, it’s very schmick!
So I’ve updated all PriceFinder videos on this post, as well as PriceFinder’s comparison score to reflect the new user interfact.
You can get the full highlights of the latest (September 2016) PriceFinder release here
Cheers,
Matt
Original Post
PriceFinder…
CoreLogic RP Data…
Real Estate Investar…
If you ever wondered which one of the above resources is for you, you’ll want to bookmark this blog post.
I’ve Google searched every combination of PriceFinder vs CoreLogic RP Data vs Real Estate Investar and nowhere on the internet is there an unbiased, across the board comparison of these massive tools… until now.
It’s about time someone did a decent comparison on these three tools, so property investors like you will be able to make an informed decision on which one to invest in.
Let me start by saying, I think all three have their pros and cons. There is one that I prefer over the others for personal reasons but my intent is to give you enough information to make your own choice.
I’m going to be upfront though and say that neither of these three great online resources will make you an instant success as a property investor.
Yes they all have exceptional filtering tools to assist with locating a suitable property for you to invest in but at the end of the day, that’s all they are: filtering tools.
You still need to get rubber to the road and look at potential property sites yourself because there’s nothing that will replace real action.
Consistent action towards achieving your goals will always yield superior results that will sustain you for the long term.
So Let’s Get Started!
(Before you continue, bookmark this page now because you will want to return to it later.)
Part I: Real Estate Investar
Part II: PriceFinder
Part III: CoreLogic RP Data
Part IV: And The Winner Is…(Final Verdict)
Part I: Real Estate Investar
The biggest advantage Real Estate Investar (REI) has over it’s competitors is that it has a core focus towards everyday property investors.
With this in mind, REI keeps its emphasis based around how and why a property investor would be searching for a particular property based on the strategy being applied and the specific results looking to be attained.
REI extract their core data from Australian Property Monitors so you can be sure that their information is accurate.
There is also a lot of supplementary property information collated by REI that can be attained via the Internet across a multitude of websites.
Having said that, the data is accumulated and presented in an easy to understand way that would otherwise be inefficient and time consuming to access many different websites and platforms.
REI have gone out of their way to create a resource that is a ‘one stop shop’ for conveniently accessing quality data that can be utilised to research investment property and have succeeded in doing so.
REI have recently upgraded their entire website and has become a much cleaner experience for the user. The data is easier to access and simpler to correlate when assessing multiple properties.
They also have a free Membership that has a stack of great resources including:
- Comprehensive search for any suburb in Australia that reveals handy statistics for median, rental and sales for that month
- Four sets of Top 50 suburb reports
- Renovation calculator and 20 point Investor checklist
- eBooks, webinars, articles and case studies on a variety of strategies
Click here to start using Real Estate Investar
The Nuts and Bolts of Real Estate Investar
There are seven key modules to the REI online resource and it’s best if I go through each one individually to provide a clear outline of what each one does and how they relate to each other.

Real Estate Investar: Search
Module one really is the meat and potatoes of the entire resource and you’ll find that it will often interact with most of the other modules seamlessly.
Below is a short video that provides a quick overview of the basic benefits of the search module in REI (Real Estate Investar):
There are three phases to be aware of when you are using the Investar Search functionality.
The first phase predictably provides some simple filtering that allows you to look up a property by type, location and price. Where REI really comes into its own is when it provides more advanced search parameters that are specifically suited to property investors.
REI has included extra keyword research filters by including keywords that apply to the strategy being implemented by the user. In fact you’ll find over 240 property investing keywords to choose from, which are correlated to the type of strategy you are applying.
The keywords relate to the words used in various property listings on a multitude of websites such as realestate.com.au, domain.com.au, homehound.com.au and many others.
REI trawls the information on those websites and correlates the keywords with the keyword parameters in its program.
For example you might choose subdivision as your strategy and REI will associate all the words relating to subdivision that would appear in ads on the relevant websites on the Internet.
Coupled with this advanced search facility are some added parameters to help narrow down the search for a suitable investment property.
These include suburb rental yield, suburb capital growth and a percentage of the suburb median.
Kate showed up to the Property Launchpad with no experience. Now she's set to make $100k in the next 12 months!
Want to do the same? Apply now!
Property Launchpad - your ticket into the highly-profitable world of Joint Ventures!
The above three search parameters greatly assist with refining the information you are requesting to ensure a more defined result, which creates a more efficient use of your time while researching.
The second phase to note within the Investar Search functionality is the comprehensive results it spits out once you click the search button.
Not only does it give you the standard statistics around median price, rent and growth but you’ll also be exposed to another half a dozen or so resource reports that can be downloaded.
These conveniently relate to mapping, planning applications, local council and state infrastructure, comparable properties sold and rented in the area and more. Most of these resources can be accessed for free online but don’t underestimate the time it would take you to pull all that data together in one place.
The final phase inside the Investar Search functionality comes when you choose to drill down further on a specific property and you are taken to the Property Analyser module which I discuss here.
Real Estate Investar: Development Search
The second module to REI is the development search functionality. This is ultimately geared towards a user wanting to access data for ‘off the plan’ investment properties.
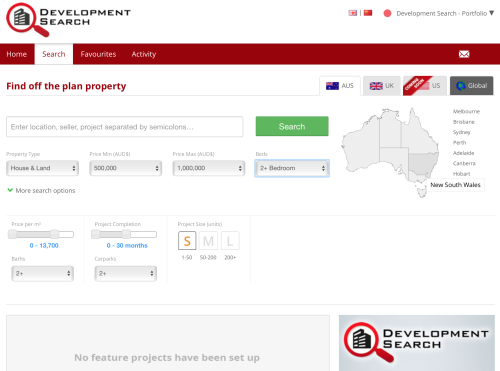
The comprehensive search engine within REI accesses thousands of development listings that are either yet to be constructed, currently in construction phase or just coming to market.
The advantage an REI user has here is that they can access presale or exclusive listings by connecting directly with the developer without using a real estate agent.
Once the user drills down to a particular development inside the Development Search module, they can access photos, artists’ impressions and architectural data to assist with assessing the development and its individual dwellings.
You’ll also discover project level information such as construction start and end dates, how many dwellings are being built, depreciation schedules and furniture packages being offered which you would normally only access through a project release event or real estate agent.
Coupled with this is the obligatory data provided around suburb and site specifics such as comparable current rental and growth yields, vacancy rates along with non-project listings available and their time on the market.
REI wraps up this module nicely with an easy to use favourites section so you can build a list of comparable properties.
They have even provided a facility to actually reserve stock live on the site, which initiates a path to the developer, liaison with your solicitor and ultimately preparing an offer to purchase.
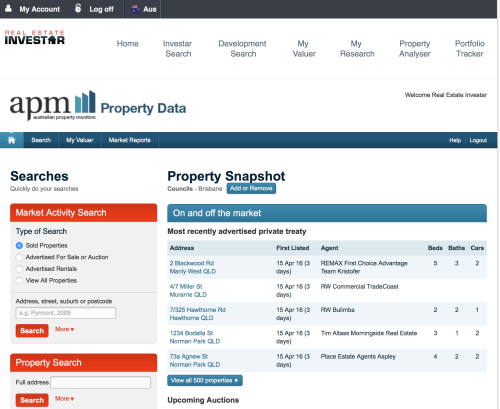
Real Estate Investar: My Valuer
The My Valuer module is powered by Australian Property Monitors (APM) and provides unlimited access meaning you can search for as many properties as you want across Australia.
If you have used APM before you’ll know the search functionality is a little clunky but if you use the one line address search bar it’s not too bad.
Once you’ve located an address or suburb, the My Valuer module (via APM) produces a comprehensive PDF of relevant statistics that you can download or print off ready to take to auction or negotiate a sale price.
The report calculates a valuation estimate based on the algorithm search ‘on sold’, ‘for sale’ and ‘for lease properties’. You’ll also see a ‘confidence’ score to gauge how accurate the estimate has been.
Some of the statistics generated in addition to the price estimate include:
- A complete summary of the features of the property
- On the market history
- Market snapshot and demographics for that postcode
- 10 year market trends showing the change in median price and percentage
- Relevant comparable sales and rentals
Overall a very handy module to have access to especially if you are looking for property valuations on a regular basis
Real Estate Investar: My Research
The My Research module is a powerful analysis tool to help understand the value of a property in its marketplace.

The search engine will look for properties that have been sold, advertised for sale and rental or all of the above.
The findings are presented on a Google map where you can filter your search further from there. You can also lock the map once you are satisfied with the results and want to focus in on the area specifics.
There is also a great Search Summary tab that gives a good overview of the comparable sales you have been looking at along with average and median prices coupled with highest and lowest prices.
You’ll also find an additional search engine within the My Research module that allows you to search by suburb, which then correlates to the relevant council area for that suburb.
You can choose multiple suburbs and the results reveal properties that are currently advertised for sale or auction or sold.
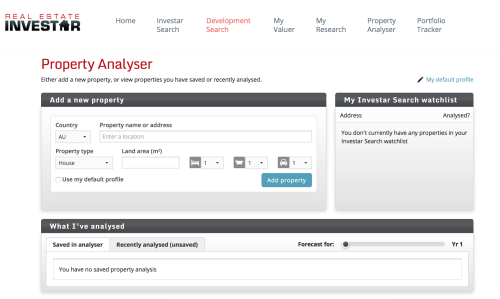
Real Estate Investar: Property Analyser
The Property Analyser module scrutinizes yields and capital growth Australia wide for properties on and off the market. You can use it as an individual module to assess a specific property or use it as part of the Investar Search module as noted above.
I found the Property Analyser to be a great tool when assessing the ‘buy and hold’ prospects of your prospective investment property.
The statistics are presented in such a way that the user can access a comprehensive snapshot of the property’s feasibility if held for the medium to long term.
As shown in the above image, REI lays out a five-year assessment of holding the investment property that includes indicators of
- Capital growth rate with CPI adjustment
- Market value in relation to the debt level (Loan to Valuation ratio)
- Surplus equity available each year in relation to projected capital growth
- Rental income and how that relates to equity and associated buying power
- Yearly gross and net yields
- Projected expenses and how that relates to potential tax deductions to create a positive or negative cash flow
These figures can all be manipulated by inputting more accurate and user specific default parameters relating to the purchasing entity, purchase price and expected value of the property.
The above table also converts the data into graph form to view the data with a more visual representation.
The data can then be moved and saved to the Portfolio module of REI to create a unique document that provides insight to cash flow, capital growth and tax implications of a specific investment property.
Real Estate Investar: Portfolio Tracker
The sixth module in REI assists the user in organising multiple properties that are being evaluated and held for the long term.
This is a handy resource to assess your entire portfolio by accessing a snapshot of your unique scenario.
The portfolio Tracker allows you to track all income and expenses related to one or multiple properties, which is great for measuring your cash flow forecasts against its actuals.
The equity in all your properties can be tracked in a similar way to show debt to valuation ratios, which helps when assessing overall portfolio risk and exposure. It’s also a great way to look at the market retrospectively to see what you predicted and how the capital growth actually panned out.
Real Estate Investar: Xero
The final module to REI’s comprehensive research tool is its interaction with the popular bookkeeping accounting package, Xero.

Bookkeeping is often a task that gets overlooked for property investors so REI have cleverly incorporated Xero to assist with this mundane but very important task.
Xero has a very intuitive design and an easy to use interface, which means it’s simple to implement the Xero Cashbook functionality to its full potential.
Xero is a cloud-based program, which means no software to install, and you can access the information and share with your accountant at any time.
Xero connects automatically to your bank so you can instantly access bank balances, recent rental income and expenses, to ensure you are across your available cash flow by regularly reconciling the books without the pain of data entry.
Although this seventh module does not provide any direct benefit to your property investing research process, it does round out the program nicely for those that want an all in one system that helps manage the procedure of buying, evaluating, purchasing and holding property investments.
Real Estate Investar: Cost
As you would expect, a comprehensive, all in one package such as Real Estate Investar doesn’t come cheap and will depend on how serious you are as to whether you make such a substantial investment.
There are three payment options to access Real Estate Investar which is called the Portfolio Builder Subscription Pricing and choosing the right package will depend on how long you make the commitment to the program.
- $249 per month for month to month with no contract
- $149 per month for a 12 month contract
- $99 per month for a 24 month contract
If you would like to try it out, click here to start using Real Estate Investar
Real Estate Investar: Support
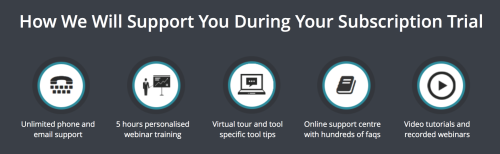
The quality of support is outstanding, particularly throughout and includes:
- Unlimited phone and email support
- Personalised webinar training
- Comprehensive video tutorials
- Online support centre
Time is our most valued commodity and REI definitely assists the everyday and professional investor by providing efficient tools to minimise the time required to research and evaluate prospective investment properties.
Real Estate Investar: Pros and Cons at a Glance
Positives
- Instant startup: Click here for immediate access
- Multiple payment packages to choose from
- Keyword research specific to property investors
- States like Victoria that have strict privacy policies still provide valuable data.
- Access to unlimited Australian Property Monitors (APM) valuations
Negatives
- Cost is quite high unless committing to a 2 year plan
- A huge amount of statistics and search functionality can sometimes cause analysis paralysis for some investors.
Matt’s rating for Real Estate Investar
Real Estate Investar is an exceptional tool for property investors evaluating at least ten properties a week.
A great resource for an intermediate or advanced investor that knows what to look for and understands multiple investment strategies and has excellent functionality for buy and hold investors.
The cost is a little high for the everyday, part time property investor but if used to its full potential would pay for itself many times over if the data is used intelligently.
I’ve broken down the rating into 5 categories to provide a good spread of assessment that supports my result.
Price: 7 out of 10 stars
Ease of Use: 7 out of 10 stars
Quality of Data: 8 out of 10 stars
Customer Support: 9 out of 10 stars
Deal Finding Capability: 9 out of 10 stars
Real Estate Investar Overall Rating: [usr 8]
Click here to start using Real Estate Investar
Part II: PriceFinder
It’s time to reveal part two of this blogpost series and discover the second of the three big players in providing essential data for property investors.
If you missed the first blogpost on Real Estate Investar, click here to go back and read my comprehensive review.
Recently, Australian Property Monitors (APM) and PriceFinder joined forces and became one of the leading national suppliers of property price information to:
- Banks
- Real estate agents
- Property developers
- Government agencies
- Media organisations and
- Consumers.
In fact, APM PriceFinder have been providing property price information services since 1989 which I was pleasantly surprised, given their rise to the top of this niche has only been in the past decade.
APM PriceFinder have some pretty heavy backing coupled with some impressive partnerships. I believe this ability to integrate with quality service providers and leverage off other specialised services is what has lead them to become the preferred choice of many property investors and analysts.
APM PriceFinder are part of the Domain Group which is a subsidiary of Fairfax Media Limited and their partner integrations include:
- Domain – one of Australia’s leading multi-platform destinations for property seekers
- My Desktop – Australia’s leading CRM (Customer Relationship Management) software provider for real estate professionals
- Commercial Real Estate – integrated print and online marketing and media vehicle used by The Australian Financial Review, The Sydney Morning Herald and The Age.
Like their competitors, APM PriceFinder collect and manage data from a range of property based data and imagery sources, including Government agencies, industry professionals, mapping providers and many public and private databases across Australia.
So what does all this information relating to the overview of the company mean from an investor point of view?
Quite simply, I like the way they go about their business. In years gone by, PriceFinder have often been perceived as the poorer cousin with less resources and capital to throw at its own research and development.
Over time, they have built quality relationships within the industry and fostered a team approach to create what I think is the premium tool for gathering and distributing relevant, up to the minute property data for property investors and other industry professionals.
Ok that’s the boring corporate overview out of the way, let’s get to the good stuff.
The Nuts and Bolts of PriceFinder
I love the way PriceFinder presents its data for the user to consume. They have always incorporated an easy to use approach that continues to be enhanced as more technology is employed.
Like any good software program, PriceFinder has made sure all it’s data can be conveniently accessed from multiple sections of the resource depending on what is being searched for.
Before I outline each of the key search parameters, let’s take a look at the main reason any investor will be using PriceFinder in the first place, which is accessing the Property Report for an individual property.
The Property Report
The Property Report is PriceFinder’s most pivotal page. In fact, PriceFinder was initially built and designed around this exact report.
When a Property Report is generated, the user can access 95% of the desired information including the PriceFinder Estimate (link to section) and the CMA report.
A very recent improvement has been the exceptional display of photos shown in the Property Report. The first thing you’ll see on the Property Report page is a massive feature photo of the site which also includes overlaid quicklinks so you access all the important information in one spot.
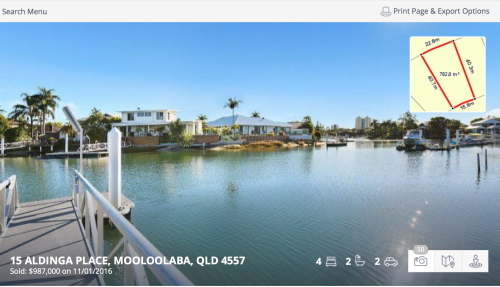
These quick access details as shown in the above image include:
- The property address and local authority
- Attributes such as number of bedrooms, bathrooms and car accommodation
- Sold price and date
- Direct link to all photos
- Google Earth link to view from directly above
- Google Street View link
- Link to interactive map
The mapping link is generally the first thing I access to obtain a quick overview of the site, especially when looking for subdivision and development sites.
Down the left hand side of the Property Report you’ll see the PriceFinder Estimate Tool and Research Tools shown in the image below, which I delve into more detail further down this blogpost.
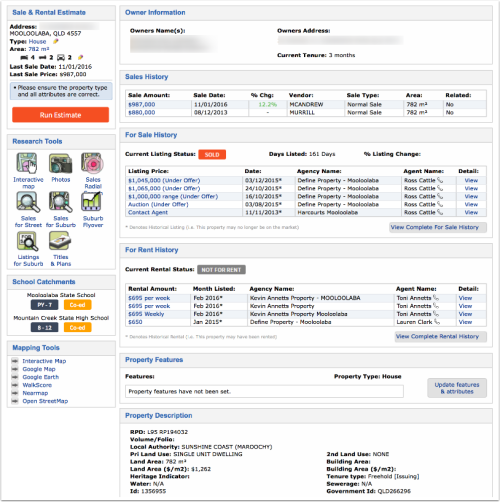
The guts of the Property Report runs down the centre of the page as shown in the image above and includes valuable information such as:
- Owner information, their address and length of ownership. This is handy when assessing if the owner lives at the property and the beginnings of understanding why they might be selling.
- Sales History that goes back as far as 30 years. Great information when formulating an offer as it reveals how much debt might be owed based on the time the owners bought the property and how much they paid.
- Rental history including weekly rent, real estate agent and the month listed.
- Real property description including lot number, land size and tenure type
- Land valuation for the previous ten years according to council valuation.
- Nearby planning and development applications which come in handy when looking for any recent approvals that might set precedence in the area.
- Some basic growth charts and graphs
For most property investors, the details shown on the above PriceFinder Property Report will suffice for any initial feasibility on a potential property site.
There are a number of ways to get access to the Property Report you are searching for so let’s go through the various paths you can take to get to this outcome.
Liking PriceFinder?
As an Ultimate Property Hub Member you will receive a secret weblink that allows you to purchase PriceFinder directly at a heavily discounted price (Saving you up to $1122 per year)
Click here to become an Ultimate Property Hub Member and access PriceFinder at almost half price!
PriceFinder’s Five Key Search Sections
As shown in the image below, there are 5 major search parameters the user can interact with to find property data that is being sought after:
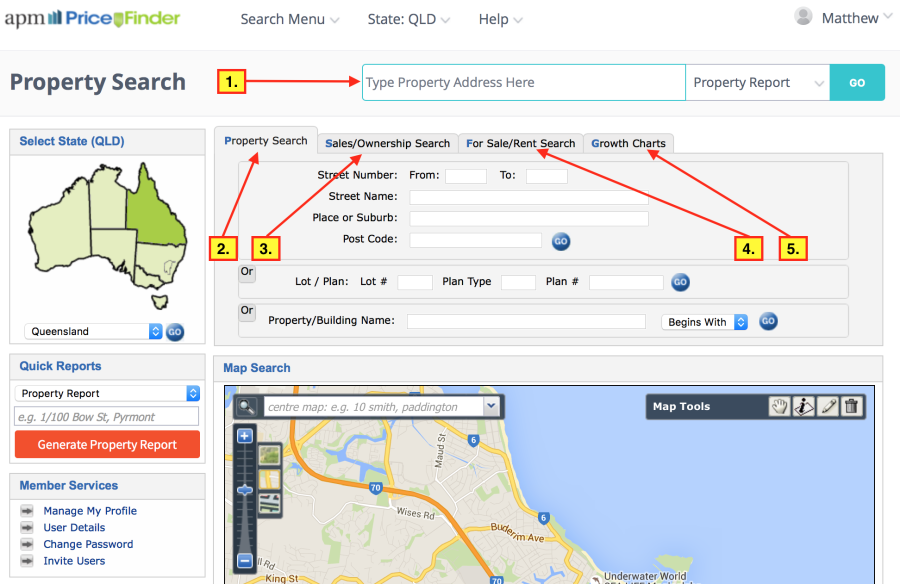
- Quick Search toolbar [jump to section]
- Property Search tab [jump to section]
- Sales/Ownership Search tab [jump to section]
- For Sale/Rent Search tab [jump to section]
- Growth Charts tab [jump to section]
Once you run a search on any of the above sections, PriceFinder spits out the relevant data along with another bunch of great One Click Research Tools that provide even more search functionality.
Depending on which tab you’re searching in, these One Click Research Tools include:
- Sale and Rental Estimate
- Research Tools that include:
- Interactive Map
- Photos
- Sales Radial Search
- Sales for the Street
- Sales for the Suburb
- Suburb Flyover
- Listings for the Suburb
- Titles and Plans
- School Catchments
- A Variety of Mapping Tools including Google, Walk Score nd NearMap
Let’s take a look at each one of the 5 search tools along with the associated One Click Research Tool links.
The PriceFinder Quick Search Toolbar
The Quick Search Toolbar at the top of the page is a pretty powerful feature and has had some recent upgrades that are well worth exploring.
Depending on the level of detail you type into this handy search bar will determine what reports are available for you to access.
Type in the street number and first few letters of the address and then select the address from the drop down menu.
You’ll have the choice of accessing a:
- Property Report
- Property Map
- Property Estimate
Remove the street number and the choice of reports change to include:
- Sales Report – a history of sales in that street
- Ownership Search – a current list of owners in that street
- For Sale Search – a list of all properties in the street currently for sale
- For Rent Search – a list of all properties currently rented in the street
Remove the street name and just leave the suburb to:
Have the drop down list add the Suburb Flyover Report. This report reveals substantial information about the suburb. I discuss this report further down the blogpost in the Growth Reports Tab section.
All of the above reports and search parameters are also found within the search tools section in each of the tabs. Let’s take a look at those tabs now.
PriceFinder Property Search Tab
From the Property Search tab you can search a property, street, lot or plan number or building name.
Simply typing in a suburb and street name will take you to the search results for the street.
From there you can click on any address to access the property report or use any of the shortcut search tools to view all past sales for the street, suburb, current listings and rentals.
You can also perform a handy suburb flyover here to get a snapshot of the area growth charts.
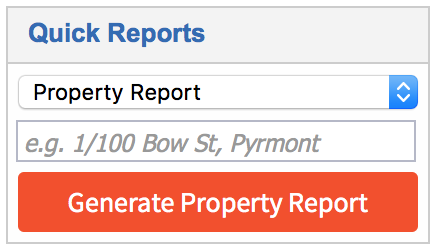
Also within the Property Search tab, you’ll notice on the left side there is a new feature called Quick Reports.
Here you have the ability to type in an address and select one of the four reports which include:
- Property Report
- Suburb Flyover
- Comparative Market Analysis (CMA)
- Title Search
There is also a handy Recent Searches box that provides a shortcut link to access the last 10 property reports that you visited.
PriceFinder Sales/Ownership Search Tab
This tab is a great feature that provides access to the all important sales and ownership details of any given property.
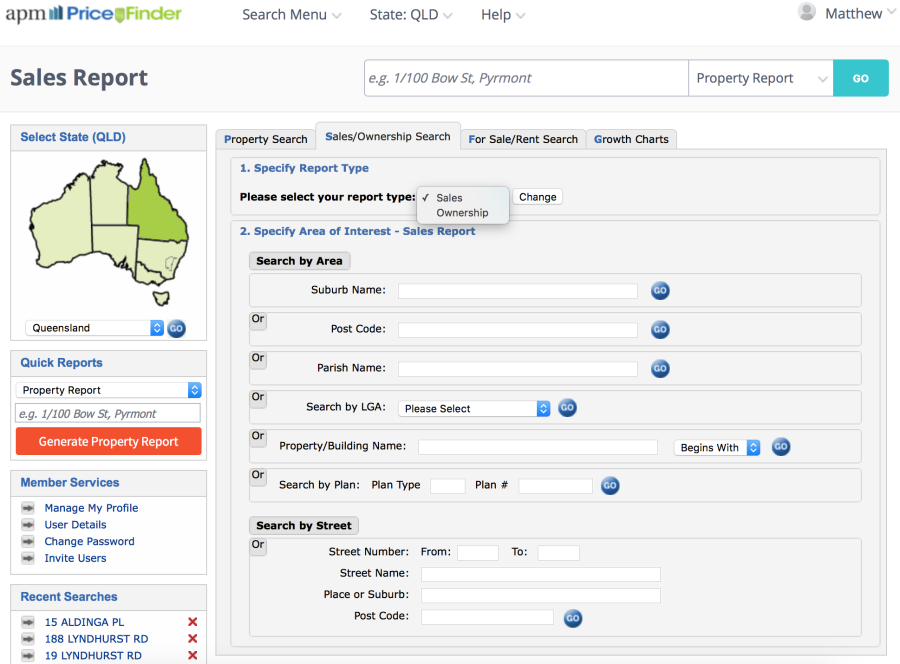
Much like the Property Search tab, simply type in the street and suburb name, select the property you are interested in and PriceFinder will reveal the property report for this address.
As the title suggests, the search tab is broken up into two parameters, Sales and Ownership.
This is so simple, it’s scary.
Just choose a suburb in the ‘Sales’ parameter and the program defaults to displaying the last six months of sales in that area.
This can also be filtered down to show property type with specific land size, sale price & date… even the number of bedrooms.
Once the search button is clicked, up pops an exportable list of properties with owner’s name, address, sale price and sold date.
PriceFinder also displays an interactive map displaying exactly where each of those sold properties are located.
This is very handy if you’re new to the area and want to start driving around a suburb with a recent sales report printout to assess what properties sold when and how much for.
You can follow the exact same process in the same tab but this time choose the ‘Ownership’ parameter.
Once you’ve created a list of owner’s contact details in any particular suburb, you have the ability to discreetly target specific property sites that suit the strategy you wish to implement.
This is a particularly good strategy when looking to acquire properties that have not yet come to market. Instead of waiting for them to be listed, you can turn the tables and have an agent approach the owner on your behalf, asking if they’d like to sell… stranger things have happened!
PriceFinder For Sale/Rent Search Tab
Once again we’re looking at a very similar format to the Sales/Ownership Search tab but this time we’re looking at what’s live on the sales and rental market.
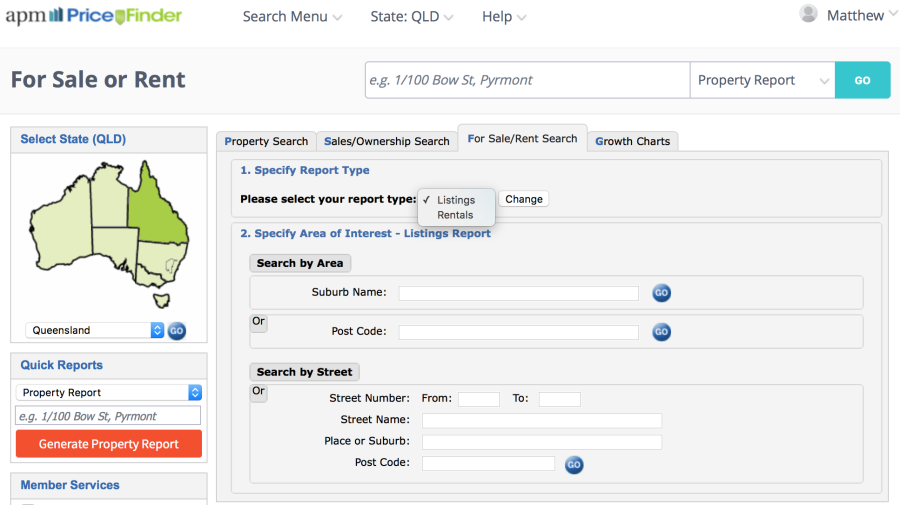
This might not seem like anything special given every sales and rental listing can be found on realestate.com.au
But here’s the kicker…
The longer a property is on the market, the more undesirable it becomes and often the vendor becomes more negotiable depending on the circumstances.
With a complete list of all the properties for sale in your area of interest, you can then sort from oldest to newest and cherry pick the properties that have been sitting there for longer than 12 months and start digging for problems that need to be solved.
Why is that so powerful? Check out the video below to see how you can use this to find stale properties and negotiate substantial discounts.
Like the previous tab this one also has a dual purpose in that you can follow the same process to find all the current and previous properties that have been rented.
This may not be a critical search functionality but still a handy tool for investors looking to assess an area for potential rental returns and vacancies
PriceFinder Growth Charts Tab
The Growth Charts tab is also referred to as the Suburb Flyover and is exactly as it sounds. A comprehensive bird’s eye view of the key market indicators of your chosen suburb.
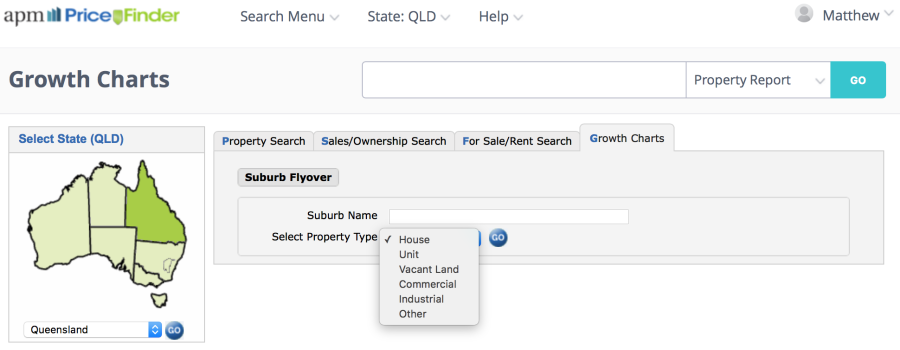
Simply type in a suburb and click search and you’re presented with six tabs of great information that will assist with assessing the viability of that area.
The six Suburb Flyover tabs include:
Quick Charts
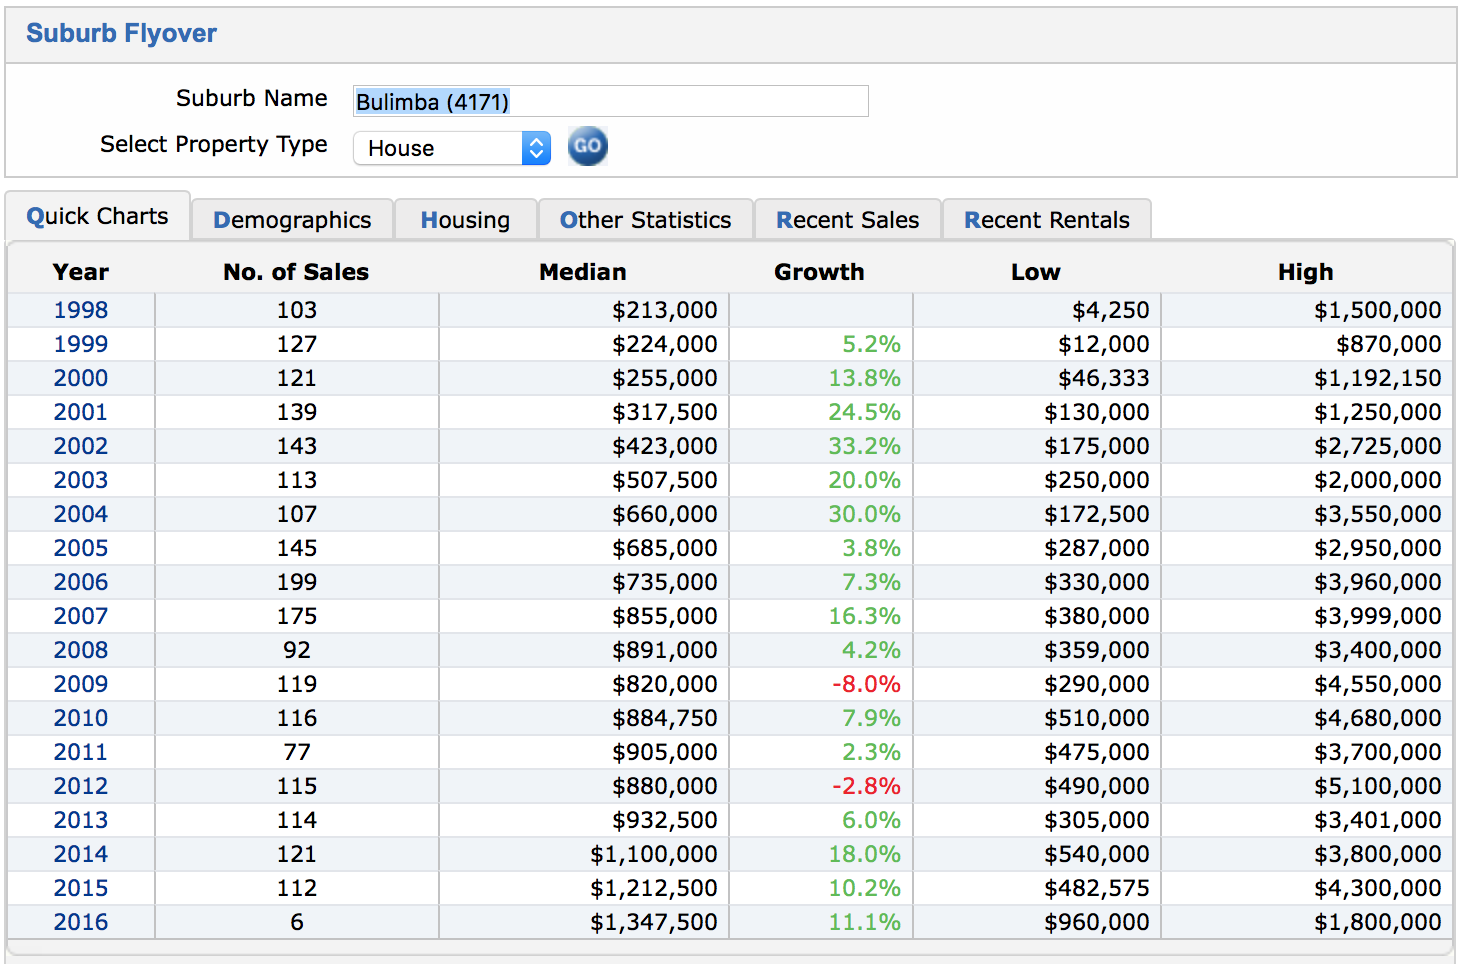
The quick charts tab provides a snapshot of the last 15 years and includes number of sales, median price & growth percentage plus some easy to read charts and graphs to visualise the trends.
Demographics
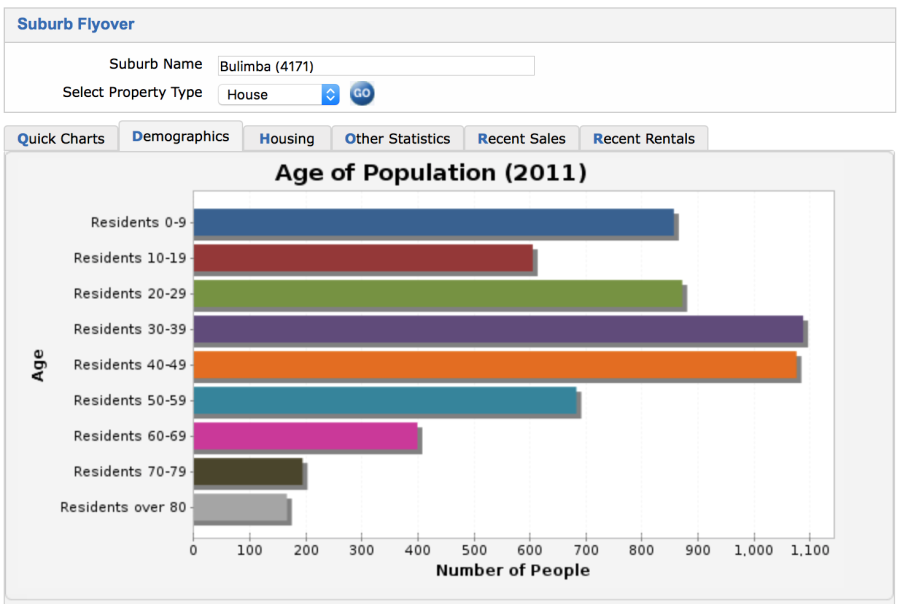
The demographics tab includes the population based on the previous Census along with the family composition of household i the area. Both are articulated with visual graphs.
Housing
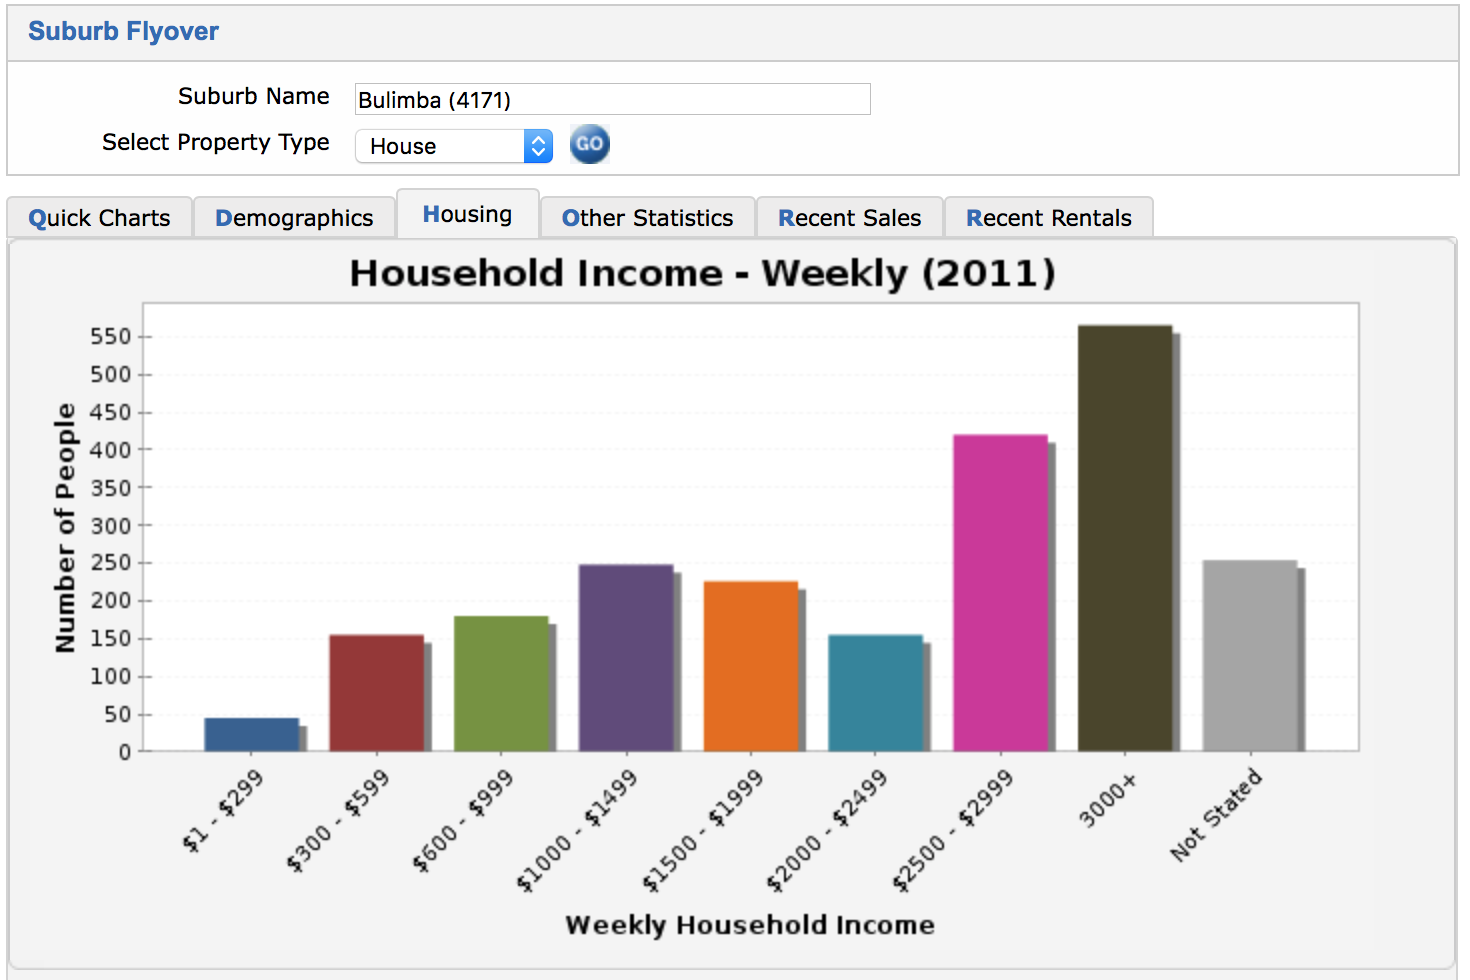
The housing tab pertains to average weekly household income, dwelling types, home ownership and average home repayments.
Other Statistics
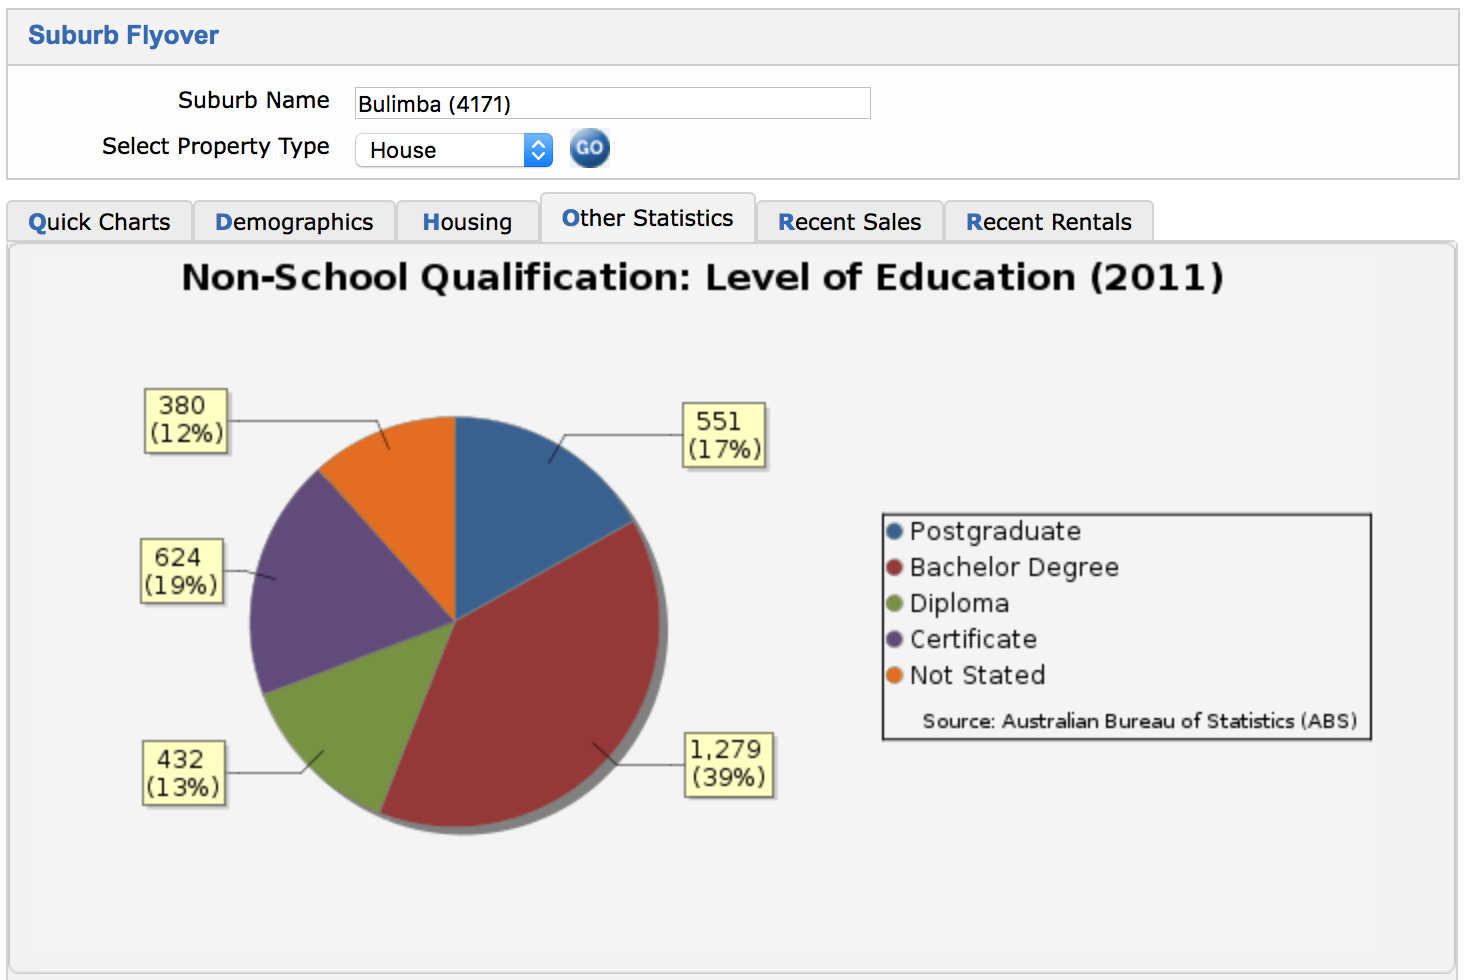
This tab includes level of education, employment levels and occupation types.
Recent Sales
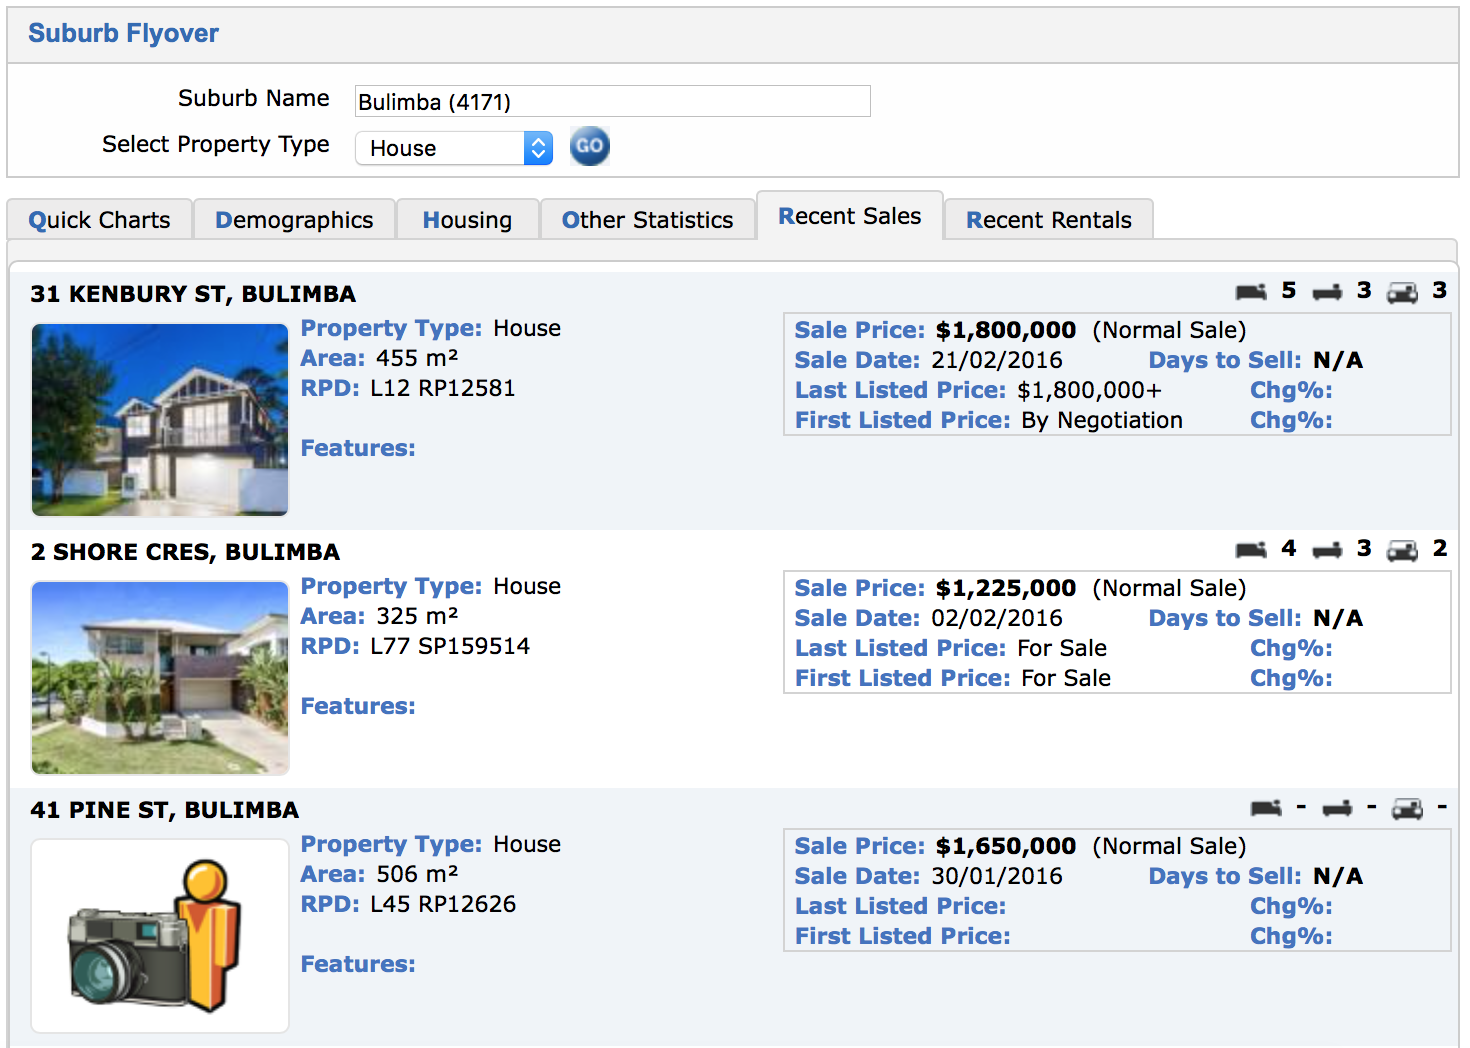
The recent sales tab shows sales from the past six months for all categories of dwellings.
Recent Rentals
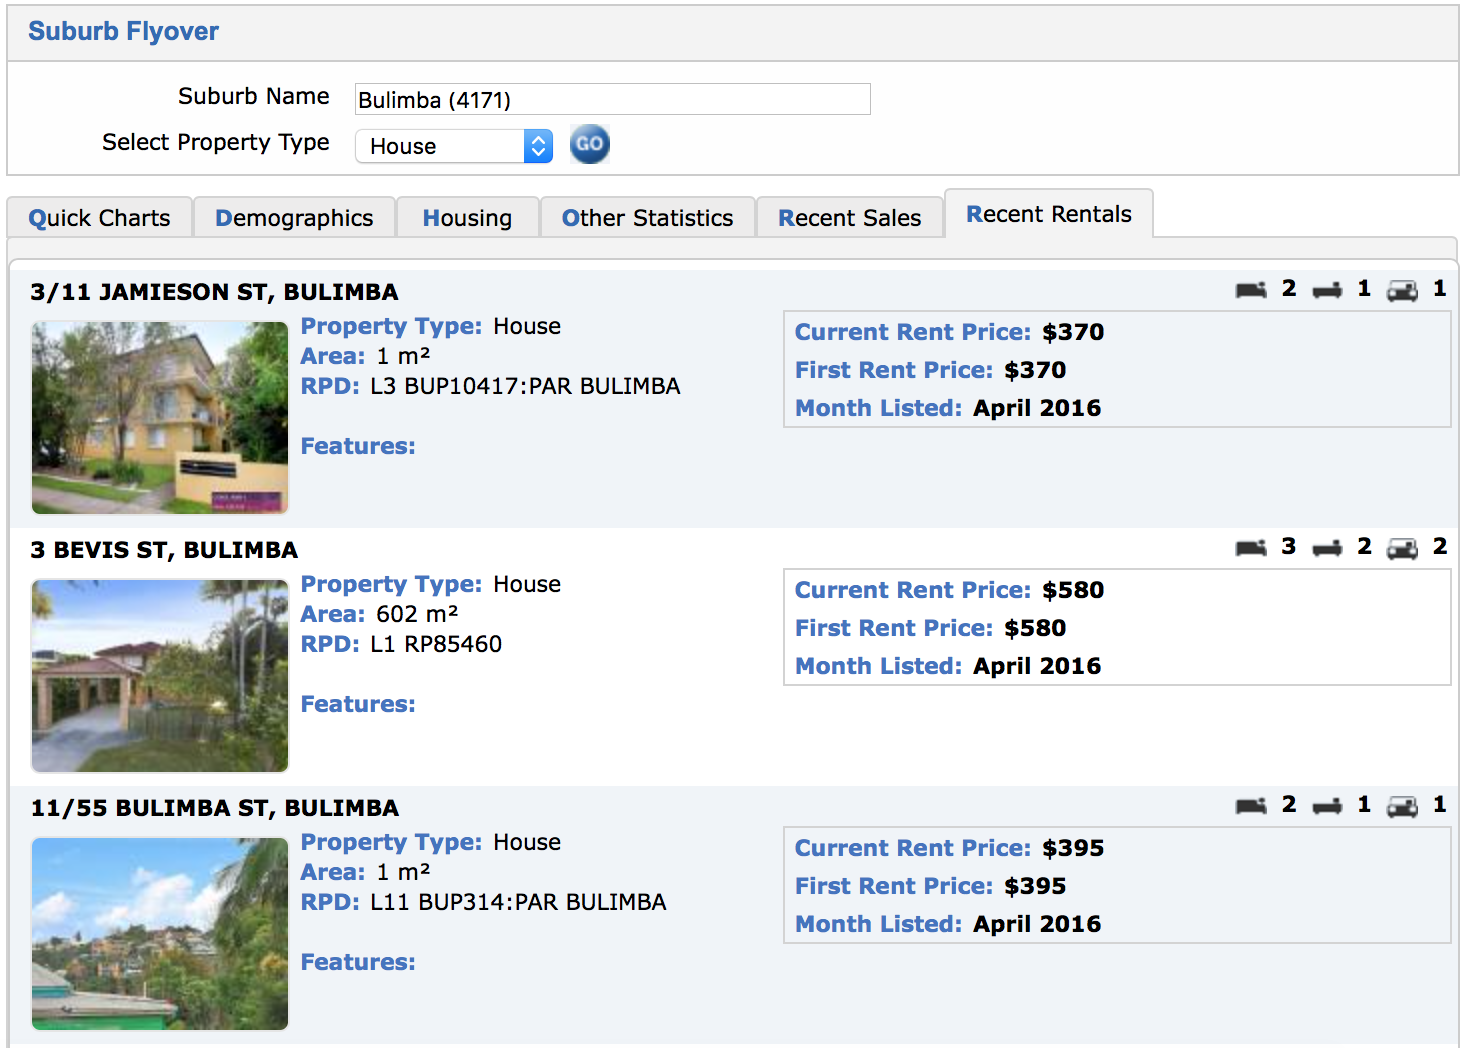
Similar to the recent sales tab, the recent rentals tab shows rentals from the past six months showing all types of dwellings.
So now you should have a good understanding of PriceFinder’s search functionality.
Let’s go back to PriceFinder’s pivotal document, the Property Report and work down the left hand side of the page where you’ll discover some extra research tools to enhance your search capability.
Liking PriceFinder?
As an Ultimate Property Hub Member you will receive a secret weblink that allows you to purchase PriceFinder directly at a heavily discounted price (Saving you up to $1122 per year)
Click here to become an Ultimate Property Hub Member and access PriceFinder at almost half price!
PriceFinder Estimate Tool
PriceFinder has some phenomenal functionality and search filters that allow you to check out sales history data for the entire street, suburb or via a customised radial search.
But PriceFinder has taken this function to a whole new level.
It’s called the Property Estimate Tool and has become one of the favourite applications in the software.
You’ll find the Property Estimate Tool on the left hand side of the Property Report once you search for a particular property as shown below:
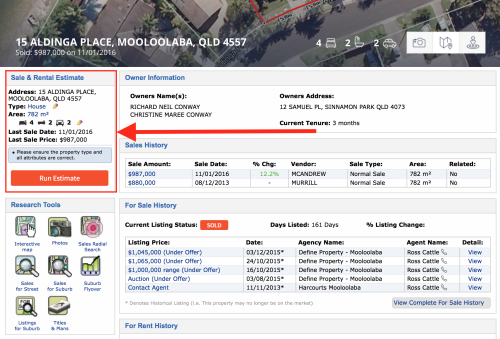
All you need to do is click on the Run Estimate button and PriceFinder will spit out the top 6 comparable sales using its clever algorithms and parameter matching software.
You can then adjust the similarity to your property using a sliding scale on how accurate you believe the price comparable to be.
Literally within a few clicks you have created your own estimated sales value report that can be used to back up your own offer to the agent or vendor.
This data, along with all the photos and mapping information provided, allows you to formulate a comprehensive view on what the property is worth, without leaving the comfort of your own home!
This video articulates the above strategy:
Research Tools
If you continue to move down the left hand side of the Property Report page you’ll see an array of icons under the Research Tools panel.
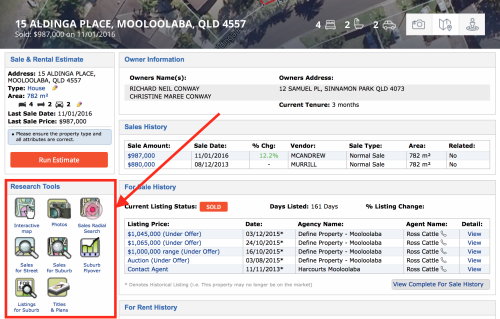
Each one of these shortcut links play a pivotal role in drilling down to further information on the property of interest. Let’s take a look at each one now:
Interactive Map

You may have already accessed this via the thumbnail in the property’s feature photo at the top of the page. Clicking on the interactive map icon will open up the mapping application.
Jim Valery shares his Property Launchpad experience!
Do you want simple, predictable, big-time property profits? Save your seat now!
Property Launchpad - your ticket into the highly-profitable world of Joint Ventures!
I found the mapping tool to be quite advanced and easy to use. Using the measuring tool is a commonly used function that is helpful for understanding the boundary realignment potential on a property or neighbouring sites.
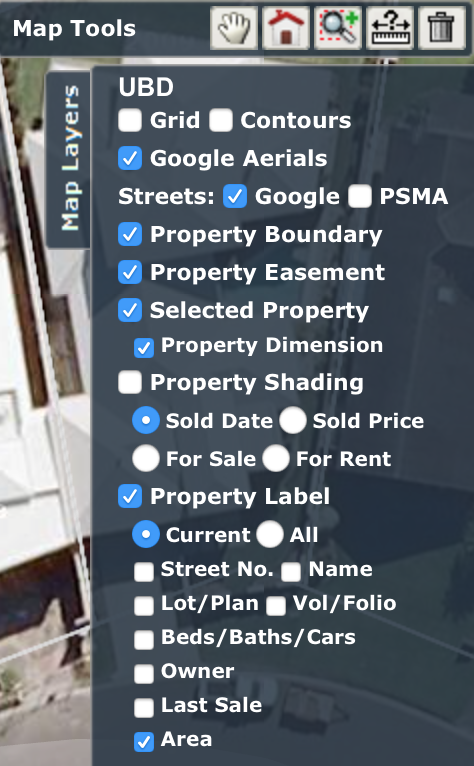
With a simple click you can quickly access details about your chosen property or any of the surrounding properties including:
- Nearby easements
- Basic contouring
- Property dimensions and area
- Sold date and price
- Owner details
- Street or lot number
- Plus a stack of other site specific detail
Now that PriceFinder have enhanced their photo display at the top of the Property Report page, the mapping application has a whole new lease on life given it accesses the same display section. This makes navigation far easier to use.
Photos

Imagery of the property you are interested in is always important and by clicking the photo icon, a new page appears with any current and past photos taken of the property.
On the same page is a list of the property features however this often only has the basic information (bed, bath and car) since it relies on agents to input the data.
Sales Radial Search

If you’re looking for sales data that extends past the street but less than the perimeter of the suburb, the radial search is a handy tool.
By clicking the icon, PriceFinder defaults to a 500m radius search around your property of interest and this can be customised to any dimension.
The results are displayed on a handy location map as well as a full list of the associated properties below the map including a thumbnail photo and a stack of relevant data as shown in the image below:
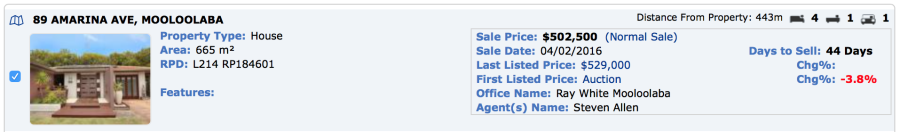
This is a fast and effective way of assessing the value of your property by looking closely at the surrounding sales.
Sales for Street

Much like the above radial search, this research tool provides similar data but confined to just the sales in the street you are investigating.
The list of sales generated is quite long and detailed given PriceFinder extracts all sales for the existing houses in the street as far back as 30 years.
While this is not necessarily an important statistic given the irrelevant timing, it’s handy to know what the trend for the street has been over time.
Sales for Suburb

PriceFinder repeats the above approach but this time providing far more sales data given the larger geographical footprint it is capturing.
With this in mind, PriceFinder gives you the opportunity to filter the
parameters before providing the results.
These parameters include, length of time between sales (defaulting to 6 months), land size, sale price and property features.
Suburb Flyover

The benefits of this feature was detailed earlier in the blogpost. This research tool is a comprehensive bird’s eye view of the key market indicators of your chosen suburb.
Click here to go back and read more detail about this feature.
Listings for Suburb

This is also another duplicated shortcut and allows the user to filter out and display all the properties for sale in the chosen suburb.
This shortcut effectively takes the user to the For Sale Rent search tab and you can click here to go back and read more about this search functionality.
Titles and Plans

This is a handy shortcut to access the lot number and registered plan details along with the cost to purchase the title and plans of the property.
You may need to contact PriceFinder directly by phone to organise the purchase of this documentation.
Bonus Filtering Options
You won’t find this filtering tool in any other program which is why PriceFinder stand head and shoulders above the rest when it comes to property investors… at least for people investing in Queensland anyway.
A colleague of mine, Daryl Rae managed to unearth this bonus filtering tool which has proven to be very popular amongst investors interested in subdivision.
In the video below you’ll discover a great trick to locating all the splitter blocks in a particular suburb.
A splitter block is a property that has two lots on one registered title. These types of sites are generally found in Queensland and have proven to be subdivision goldmines.
The reason for this is in most scenarios the fact there are two lots on one title negates the need to pay council contributions which can equate to a cost saving in the vicinity of $25000.
Check out the video below to discover how you can uncover these exceptional sites.
I would like to acknowledge Daryl Rae for his contribution to this video. Daryl is a long time contributor at Property Resource Shop and a member of our Ultimate Property Hub PLUS he is a successful property investor in his own right (he retired from his job at aged 40!)
Daryl taught me the above strategy many years ago and it has assisted me to find a stack of splitter block deals which has lead to some amazingly profitable opportunities – thanks Daryl!
Training Resources
PriceFinder have compiled a comprehensive library of videos that explain the many uses of the program. It’s always great to see a company not only provide the tools but show you how to use them with professionally recorded content.
Whether you are a first time user of PriceFinder or an old hand, the support provided is outstanding.
You’ll often find that PriceFinder also run live and pre recorded webinars that give you direct access to the support team to ensure you become a prolific user of this resource.
Cost
As you would expect, a comprehensive, all in one package such as APM PriceFinder doesn’t come cheap and will depend on what service you are providing in the market as to what package is most suitable.
Since this blogpost is geared towards informing property investors on the benefits of PriceFinder, I will only be sharing prices available to that niche of users.
If you are another service provider within the industry, such as real estate agent, valuer, mortgage broker or other enterprise or government body, you’ll need to contact PriceFinder directly for a quote.
Purchasing a PriceFinder subscription directly will cost $192.50 inc GST or $2310 per year.
PriceFinder are great supporters of local property networking groups and allow select groups (such as ours) to provide their resource as part of an investor package.
Click here for more details on what’s included in our investor package.
PriceFinder: Pros and Cons at a Glance
Positives
- Easy to use, intuitive operating system that continues to improve
- Quality phone applications for iPhone and Android
- All data is exportable into need spreadsheets and PDF’s
- Affordable for property investors through property networking groups
- Unique search functionality to locate splitter blocks
- High quality training and customer support
Negatives
- Cost is quite high unless accessing through a property networking group
- A huge amount of statistics and search functionality can sometimes cause analysis paralysis for some investors.
Matt’s rating for PriceFinder
PriceFinder has become my personal choice for gathering and filtering property data to assist with my property deal feasibilities.
I tend to have PriceFinder open permanently on a second monitor screen because of the constant referring to this great resource.
I find the mapping tools and one quick research tools exceptionally good and have learned to appreciate the simplistic layout and display of a huge amount of data.
I’m also heartened by the fact that this company never seems to rest on its laurels which is proven by its constant improvements in developing this state of the art program.
Price: 9 out of 10 stars
Ease of Use: 10 out of 10 stars
Quality of Data: 9 out of 10 stars
Customer Support: 9 out of 10 stars
Deal Finding Capability: 9 out of 10 stars
Update: Due to the new user interface (released September 2016), we’ve updated PriceFinder’s ease of use score from 9 to 10!
PriceFinder (Updated) Overall Rating: [usr 9.2]
Liking PriceFinder?
As an Ultimate Property Hub Member you will receive a secret weblink that allows you to purchase PriceFinder directly at a heavily discounted price (Saving you up to $1122 per year)
Click here to become an Ultimate Property Hub Member and access PriceFinder at almost half price!
Part III: CoreLogic RP Data
It’s time to take a good hard look at the final contender in this 3 part showdown between the big guns of online property investing researching tools.
If you missed the previous two blog posts detailing the pros and cons of Real Estate Investar and PriceFinder, I encourage you to click on the links below to read them first:
Today it’s all about CoreLogic RP Data.
Now first of all let’s clear up the naming of this company. Many investors and real estate agents along with valuers and mortgage brokers would be used to the name RP Data as far back as the previous century.
In early 2011 RP Data was acquired by an American based firm called Core Logic and they are now referred to as CoreLogic RP Data.
CoreLogic is the largest property data and analytics company in the world.
Currently they have 20,000 customers and 150,000 end users, which pretty much makes them the Big Daddy of this niche.
With a reported revenue in 2014 of $1.4 Billion they are in a high stakes industry of providing property data, analytics and related services to consumers, investors, real estate agents, mortgage brokers, banking, building services, insurance providers, developers along with banking and government sectors.
Having the biggest budget doesn’t necessarily make them the best service provider in their niche though.
CoreLogic RP Data provide a multitude of services which I think can sometimes dilute the quality provided to the smaller players in their market, which is everyday property investors like you and me.
However just like the other two competitors, CoreLogic RP Data have a premier resource for providing accurate up to the minute data to assist investors with assessing project feasibility.
Choosing Your RP Data Package
With so much scope in what this company provides, it can be a little confusing when you go to their website as they are marketing to a variety of different sectors in the industry.

As you can see in the above image, there are a vast array of clients that CoreLogic RP Data market to.
After a very convoluted search across their website, I was able to narrow down the products on offer that suited my needs as a property investor and that’s what I’ll be focussing on in this blog.
Currently there are two packages that are relevant to property investors, Property Value and RP Data Professional.
I’ll talk briefly about the first option given it really doesn’t compare to Real Estate Investar and PriceFinder; I’ll then go into further detail about the second package being RP Data Professional.
The ‘Property Value’ RP Data Package
Property Value has a free and paid version that provides limited property data researching tools.
The free version provides some basic data on market trends, and suburb profiles whereas the ‘Premium’ paid version has little more benefit for $49 a month (cheaper if paid annually).
When doing a side by side assessment the key differences between the paid and free options were:
- A more defined market estimate on a particular property rather than a range estimate.
- Pros and cons of a particular property which I found to be useless given the pro I was given on a particular property said that it was ‘high cashflow’ and the con said it had ‘negative cashflow’
- A cashflow, capital growth and risk score out of 100 which has attractive graphics but without any real substance to the score result
- A property timeline which is helpful to see the sales and rental history of the property. This would benefit most investors in being able to determine ‘ball park’ debt levels which can assist with formulating a quality offer.
- More comparable sales. The free version provides two whereas I was given 6 with the option to view more when assessing a specific property. The comparable sales show property details and a thumbnail picture for easy reference
Ultimately the Property Value option is a neat package for those wanting very basic information.
For $49 a month (less if paid annually) it’s a good starting point for a beginner investor but really doesn’t compare to the features and benefits provided in the RP Data Professional package.
As a serious investor, I’d prefer to pay a little more and get the the whole package which is RP Data Professional. Let’s check it out in detail now…
The Nuts and Bolts of CoreLogic ‘RP Data Professional’
To ensure a level playing field, my sole focus from here on in will be on the RP Data Professional package since it compares best with what Real Estate Investar and PriceFinder provide.
Once you login to your RP Data Professional subscription you are immediately taken to the home and this is where it all happens.
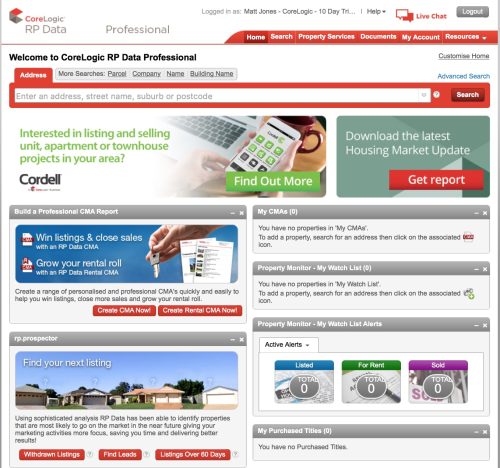
I do like the way this is laid out and can be customised to suit the user’s needs within the program.
You can actually add, remove or reposition the above information modules in and around the home screen to create a more efficient experience every time you login.
Let’s break down the home page a little so you can see how it can be best utilised when researching data on your next property purchase.
CoreLogic RP Data: The Quick Search Box
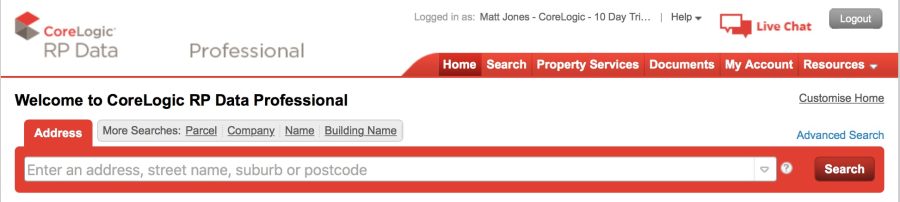
Towards the top of the home page is your quick search box which is quite a smart and efficient feature, in fact I found it to be faster than the other two competitor’s search boxes.
Simply type in part of the address you are searching for and it will provide specific matches to click on via a dropdown box.
You can also search by address, property description (lot and plan number), building name or owner’s details. If that’s not good enough for you, there is an advanced search functionality to filter down to more specific parameters.
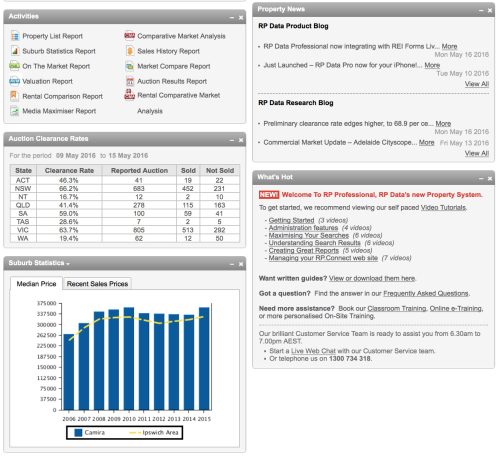
The lower section of the home page is where you can choose and position any of the shortcuts to help with easy access. Some of the main shortcut boxes include:
- The Activities shortcuts (detailed here)
- Property Watch lists and alerts to help you categorise the sites you are looking at currently.
- Latest property news feed from the RP Data product and research blog.
- Build a Comparative Market Analysis report and create a shortcut to the reports you are interested in.
- Any sales or rental listings you have currently (which applies to real estate agents)
- Shortcut to purchased titles.
- Recent auction clearance rates and suburb statistics.
These customisable modules provide a flexible home page that can be used as a one stop shop for current statistics, research data and relevant news.
CoreLogic RP Data: Activities Module
As mentioned above, you’ll find the Activities module on your homepage and is a handy set of shortcuts to help assess your next project.
You’ll also find the same shortcuts inside the Activities Module on the Property Report page which I’ll discuss further down this page.
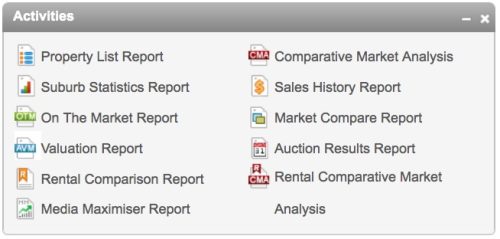
Let’s take a closer look at how these shortcuts interact within the Property Report Page
CoreLogic RP Data: Property Report
The Property Report page will be your most used feature inside the RP Professional program.
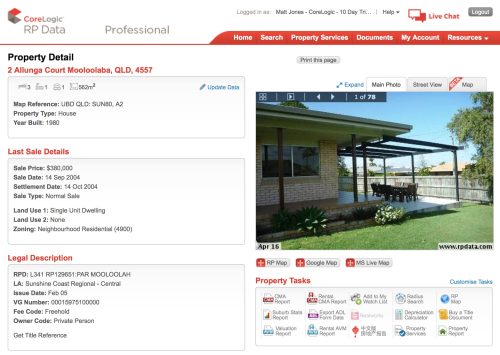
The above page is broken up into three sections. To the left is the property specifics including property details, land size and year the dwelling was built
You’ll also discover previous sales history along with the legal description of the site.
The second section is the visual module which provides any photos associated with the property and interactive mapping.
The final section has the Property Tasks module which has the same shortcuts as the Activities Module (I’m not exactly sure why they are named differently)
The Property Details section to the left of screen is pretty self explanatory So let’s move to the photo and mapping feature window.
CoreLogic RP Data: Enhanced Mapping
The enhanced mapping feature inside RP Professional is very comprehensive much like its competitors.
Instead of trying to articulate the many features of the mapping tool, there is a video embedded below.
The above five minute video provides extensive detail on how to best utilise the interactive mapping function in RP Professional.
CoreLogic RP Data: Property Tasks (Activities Module)
The third section in the Property Report page has a great range of shortcuts to provide you with more specific information and reporting on that specific property.
Let’s go through each one now:

The Comparative Market Analysis report is a handy tool for pulling a large amount of data together on a property and presented in a neat PDF ready to print. As an investor, I don’t consider these reports particularly necessary however they are a great feature for real estate agents or those wanting to present the property in a professional manner.
Included in the CMA report are specific details about your targeted property such as:
- A list of comparable properties with detailed description and photos that have been sold or still on the market.
- Screenshots of cadastral mapping and plan views of the site and surrounding area.
- Area and suburb profile including stats on sales per annum, historical capital growth of median prices.
- Demographics of the area including household income and age and sex ratios.
- Market trends with visual graphs.

The Rental CMA report is much like the above CMA report however
you can tailor the parameters to suit an analysis on a targeted rental property instead.

This handy shortcut allows you to quickly separate targeted properties and place them in an area that is easily accessible for future use.

A common tool used for determining an area in relation to your targeted property. For example a 500 metre radius around your site. From there you can access comparable sales or other property currently on the market.

A quick link to take you to the enhanced mapping feature as explained above.

A quick snapshot of key market indicators in your chosen area. Information includes graphs and charts that articulate recent sales, annual median price growth along with demographics around household income, age and sex ratio etc
This is a handy feature if you need to extrapolate the data to a different program such as Microsoft Excel where it can be analysed for different purposes or create more detailed filtering

A handy tool to assist with calculating the depreciation of a specific property after inputting some required parameters. Use only as a guide and seek advice from your accountant or quantity surveyor.

Accessing title documents of a specific property is required from time to time and being able to do this directly from the program you are working in is a great feature. Extra fees will apply to access the documentation.

An Auto Valuation Report compares the featured attributes of your targeted property then looks at all the recent sales and listings in your area to estimate your current property’s market value. A very handy tool for accessing an instant estimate on your property’s worth.
Much like the above AVM you can generate a similar report that provides a rental estimate on the targeted property.

Clearly CoreLogic RP Data are targeting chinese investors by providing a property report in chinese. Handy if you have Chinese joint venture partners!

Opportunity to access suppliers referred by CoreLogic RP Data that provide relevant property services such as building/pest/pool inspections, strata report and depreciation schedule.

A great shortcut to provide everything you need to know about your targeted property including:
- Photos and mapping images
- Property details and specifics
- Estimated valuation via the Auto Valuation Estimate
- Past sales and rental history
- Recently sold properties
- Properties currently on the market for sale or rent
- Suburb insights and statistics
Search Results Tabs
An additional feature in RP Data Professional to help you locate and target properties of interest can be found on the home page when you search for a property.
Once you type in the address and click search you’ll be presented with a number of tabs to help refine the type of property you are interested in based on your own property investing strategy.
Below is a video that articulates how to navigate this section of the program
Make sure you check your subscription inclusions to ensure you are aware of which search tabs are made available to you.
CoreLogic RP Data: Training Resources
CoreLogic RP Data have created a number of video tutorials and PDF downloads to help you navigate this comprehensive resource.
There are also some excellent training programs to help you get started and also advance your skills to get the most out of your subscription.
There are regular live classroom training sessions in Melbourne, Sydney, Brisbane, Adelaide and Perth.
You can also access regular online training sessions at various times that have specific modules to choose from based on your needs and skill level.
The live and online training is included with access to the RP Data Professional package
CoreLogic RP Data: Geographical Access
Generally an RP Data Professional subscription provides national access to locate properties anywhere in the country. Bear in mind that the complete property data is limited to the state allocated to your subscription.
If you are searching for specific data on a property outside of your subscription area you will need to purchase an out of subscription suburb.
The cost to do this can be up to an extra $30 on top of your subscription for one suburb that is accessed for 30 days.
CoreLogic RP Data: Cost
Acquiring access to RP Data Professional is not as simple as clicking a buy now button on their website. You actually need to contact them directly via phone, live chat or emailing using the contact page.
From there you can chat to a sales representative to set up the right package to suit your needs.
There is a 10 day free trial available but you will need to sign up with a company or business name here: CoreLogic RPData Free Trial
During the free trial I would expect you to be offered a number of relevant packages and you will need to speak to a sales representaive to ensure you receive the most suitable access.
The most basic RP Professional package designed for investors costs $143 per month for access to a single state. If you prefer access to the entire country, unlike PriceFinder and Real Estate Investar, the price increases substantially to $214.50 per month
Total price for 12 months access: $2574 inc GST.
Take special note of the terms of your contract. The basic investor packages mentioned above requires a minimum 6 month commitment and you will need to provide one month’s notice to cancel your subscription so make sure you contact CoreLogic in writing within five months if you intend to end the subscription after the six month contract.
It’s worth noting that the higher level professional packages have a minimum 12 month commitment coupled with a required three months notice in advance to cancel the subscription.
Additionally, as noted above in the Geographical Access section you may need to incur further cost to purchase access on top of your subscription if your suburb of interest is outside your subscription area.
CoreLogic RP Data: Positives
- Accurate, up to date property reserch data
- Quality phone applications for iPhone and Android
- All data is exportable into spreadsheets and PDF’s
- 10 day free trial, try before you buy
- Multiple packages to choose from
- Access to unlimited Auto Valuations
CoreLogic RP Data: Negatives
- Substantial Cost outlay with the potential further cost if doing research in more than one state
- Obligatory 6 month contract with long lead time to cancel
- Customer service tends to be a little slow
Matt’s rating for CoreLogic RP Data
Although CoreLogic RP Data has a massive volume of data and statistics available, the focus for this company is broad and tends to be more geared towards property industry professionals rather than everyday property investors.
Clearly this company is the market leader in providing property data to its clients but for the mum and dad type investor, its services may be a little out of touch with the needs of its lower usage users.
Price: 6 out of 10 stars
Ease of Use: 8 out of 10 stars
Quality of Data: 8 out of 10 stars
Customer Support: 7 out of 10 stars
Deal Finding Capability: 8 out of 10 stars
CoreLogic RP Data Professional Overall Rating: [usr 7.4]
Part 4: The Final Verdict
By now you should have a pretty comprehensive understanding of the three big players that provide essential data to property investors across Australia.
If not, take a look now at the previous blogposts that I’ve completed on reviewing Real Estate Investar, PriceFinder and CoreLogic RP Data:
- Part I: Real Estate Investar
- Part II: PriceFinder
- Part III: CoreLogic RP Data
After a complete, unbiased comparison it’s interesting to note just how similar these programs are when it comes to providing specific information to property investors.
This is shown by the individual ratings that were applied based on price, ease of use, quality of the data, customer support and deal finding capability.
There was a standout winner though – which I’ll get to shortly.
The Most Important Takeaway
Before I reveal the final verdict let me just point out some important insights that I’ve learned from assessing these three essential resources.
Any successful property investor worth their salt knows the key to achieving results is about taking action.

All too often I see people spending too much time in front of their computers assessing projects to within an inch of their lives.
Property is a people business and you need to be out there.
Talking to buyers, sellers, builders, town planners, council representatives and above all, real estate agents is how you get the deals flowing in your direction.
Crunching data will only get you to a certain point so whether you choose Real Estate Investar, PriceFinder or RPData keep in mind that these three programs are just filtering tools.
The funny thing about data analysis is that you can never do enough…. so it’s important to draw the line before analysis becomes paralysis.
You can have all the data, resources and tools in the world but if you do nothing with them it’s a big fat waste of time, money and effort investing in them in the first place.
How I Beat Analysis Paralysis: A Three-Step Plan
Here’s what I do to beat analysis paralysis: I have a simple 3 step plan before I start.
These days you only need to open up your laptop and there are any number of distractions to take you off course from your intended task and before you know it, half the day’s gone.
Before you start, get clear on what information you are looking for and once you have it, move on. Make a decision with the new found insights you have acquired and take action.
Check out my 3 step plan of attack that I use for every deal that comes across my desk (scroll to the text “Module Three: A Plan of Attack”)
By implementing these 3 steps, I have a much better chance of minimising my time assessing data. Thereby I move from the analysis phase to an action focussed, snowball of momentum.
So let’s get to… The Verdict!

3rd Place: CoreLogic RP Data (Overall rating: 7.4)
I gave RPData the respectable but ultimately losing score of 37 out of a possible 50 points.
These guys are the big daddy of the three in more ways than one. Their name is synonymous with property research and have been doing this for a long time.
It’s always nice though to see the underdogs (REI and PriceFinder) rising up to take on the top dog and succeeding.
CoreLogic RPData are a massive company that is American owned and have really priced themselves out of the market when it comes to everyday property investors.
Clearly that doesn’t concern them though as they have bigger fish to fry.
Thier data collection now services such a broad market that it’s sometimes difficult to see where property investors fit in anymore.
Having said that, they do provide a quality service with the complete gamut of property statistics and specifics but no more than REI and PriceFinder.
For that reason, I’d be more inclined to steer clear of the goliath of the three service providers.

2nd Place: Real Estate Investar (Overall rating: 8.0)
These guys do a great job targeting their information specifically for property investors. Their keyword based algorithms are outstanding with a search engine that rivals the best of them.
Modules like their portfolio tracker and property analyser provide a fantastic opportunity for buy and hold investors to manage their property’s key performance indicators exceptionally well.
For me though, this doesn’t excite me much.
I use these data collection tools to find deals so that I can implement active property investing strategies to manufacture profit.
Having said that, I scored REI well because it is the complete package for analysing property data and provides premium tools for everyday investors to manage their portfolio.
Just don’t get caught up analysing the massive amounts of available data!

1st Place: PriceFinder (Overall rating: 9.0 Updated rating: 9.2)
Factoring in price, ease of use, quality of data, customer support and deal finding capability, I gave PriceFinder a score winning total of 9.0 out of 10.
PriceFinder have come a long way since they came onto the market and that’s what I love about this company – they continue to improve without losing focus on what’s important:
PriceFinder provides property investing data for property investors in a simple, easy to use fashion that gets results fast.
It’s hard to go past their splitter block filtering tools which none of the other two have managed to implement.
Their recent upgrade has a far better feel and it’s clear to see they have implemented some very powerful integrations to make the user experience efficient and the data collection accurate.
I think PriceFinder have created a perfect balance between providing the right amount of data and presenting it in a way that is simple to understand and not overdone, so that the user can take the results orientated details and use them effectively.
Essentially that’s why they got my winning score of 9 out of 10. The right amount of quality data, presented well.
The Washup
If you’re serious about property investing you really need to have access to one of these paid online resources to be ahead of the pack.
As property investors we need to be able to make informed decisions quickly, based on facts – not opinion. There are plenty of newspaper columnists and commentators that have no problem thrusting their biased opinions of the market on you.
Likewise, there’s never a shortage of friends, family or colleagues wanting to share their uninformed, speculative view on what’s happening in the broader property market.
Ultimately, there is always a point in time where you as an investor need to make your own call on where to find a great deal, back that opinion and take massive action based on the facts you have been able to gather.
Real Estate Investar, PriceFinder and RPData all have their pros and cons so it’s about you finding out what resonates with your style of investing.
Yes they all have exceptional filtering tools to assist with locating a suitable property for you to invest in but at the end of the day, that’s all they are: filtering tools.
But remember… you still need to get rubber to the road and look at potential property sites yourself because there’s nothing that will replace real action.
Whatever you choose…. Always focus on capturing the data you seek and using it to take action towards achieving a specific goal.
Now back to you… Who do you think should take out #1? Leave your comment below!
Peter Baumann shares his Property Launchpad experience!
Do you want simple, predictable, big-time property profits? Save your seat now!
Property Launchpad - your ticket into the highly-profitable world of Joint Ventures!
Big news I hear that Real Estate Investar and PriceFinder are now creating new tools together.
Investors will be loving it.
Hi Ryan. Not quite… APM (Australian Property Monitors) purchased Pricefinder a couple of years ago and REI will be using PriceFinder as their valuation provider for their My Valuer/My Research platforms. Cheers, Matt
Thank you, very helpful post – which I have book-marked 🙂
Good stuff Geraldine. Dont let the page get lost in the bookmarks folder! Set a reminder to implement something from the blogpost so you get some tangible benefit. Cheers, Matt
Hi Matt, great job on the reviews, i am currently with Pricefinder in Perth, however, Reiwa have now partnered with CoreLogic. Unfortunately the current data (Pics of properties/attributes) is not current and affects the quality of output. I too have found Pricefinder to be an outstanding tool.
Hi Greg, thanks for the feedback. Yes I think PriceFinder takes a better overall approach in that they are constantly updating their program and it is more geared towards everyday property investors. Hope you find some cracker deals mate. Cheers, Matt
Great Blog, super informative and biased enough to make a decision. I did like the RPData information layers, but living on the boarder of 2 states wouldn’t be economical to purchase multiple states package.
Thanks
Hi, I was specifically looking for a real-time database that gave ‘days on market’ information for current property listings and google directed me here. I was very happy to find that not only your revealed that here, but even gave a detailed video about here. So thanks much! 🙂
One question…
Does Pricefinder give days on market info for all online listings, ie listings from BOTH Domain.com.au and Realestate.com.au?
Tx much 🙂
Thanks Matt – great report on these tools although I haven’t read EVERY word! have dabbled in REI a few years ago and really liked how you could type in the keyword search for whether you were looking for Vendor Finance, Subdivide, Renovate etc…. Can you do this on Pricefinder?
Hi Karen thanks for the question and great feedback. PriceFinder doesn’t have this specific search functionality so if you want to search by strategy, go with REI (If they still have that option). My thoughts are you need to keep these programs in their place… ie they are a filtering tool to sort out the 90% of dud deals out there. Don’t replace picking up the phone with an online program as that’s where the real deals are – in the relationships and networks you build with agents. Best of luck 🙂
Hi Matt,
Thank you for comparing these powerful tools used in real estate industry today.
My preference is Pricefinder because as you mentioned, its easy to use.
Hi Matt,
Have you tried Stash Property.
I wonder how does it compare with others?
HI Kate.. I haven’t had a good comprehensive look at but I’m sure it compares well…. essentially just another tool to help filter out the good from the bad deals using a different interface but sourcing the same data. Looks a bit expensive… I know we can get access to PriceFinder for $100 per month. Let me know how you go if you end up using it. Cheers, Matt
Matt
Many thanks for the brilliant analysis. Are you aware whether any of these services provide sales data for ALL recent sales even where the relevant parties have specified “price not disclosed?” Some recent experience with RP Data suggests that some relatively recent sales prices are not disclosed which can be quite frustrating especially when one has paid a small fortune for subscription.
Hi Farid and thanks for the feedback.The quality of the data provided comes down to agents updating their status in a timely manner along with the relevant Titles office passing through the information as required. I can understand your frustration but my take on it is they are all just filtering tools. Don’t get too bogged down with the detail… these tools are to help you sort the dud deals from the ones you want to spend time on. Hope that helps! Cheers, Matt